Developing Flutter apps in an IDE
The Flutter plugin provides a fully integrated development experience in the Android Studio or IntelliJ IDEs.
- Installation and setup
- Creating projects
- Editing code, and viewing code problems
- Running and Debugging
- Fast edit and refresh development cycle
- Advanced debugging
- Editing tips for Flutter code
- Editing Android code in IntelliJ IDEA
- Tips and tricks
- Troubleshooting
Installation and setup
Please follow the Editor Setup instructions to install the Dart and Flutter plugins.
Updating the plugins
Updates to the plugins will be shipped on a regular basis. You should get prompted in IntelliJ when an update is available.
To check for updates manually:
- Open preferences (IntelliJ IDEA>Check for Updates… on macOS, Help>Check for Updates… on Linux).
- If
dartorflutterare listed, update them.
Creating projects
Creating a new project
To create a new Flutter IntelliJ project from the Flutter starter app template:
- In IntelliJ, click Create New Project from the ‘Welcome’ window or File>New>Project… from the main IDE window.
- Select Flutter in the menu, and click Next.
- Enter your desired Project name and Project location.
- Click Finish.
Creating a new project from existing source code
To create a new Flutter IntelliJ project containing existing Flutter source code files:
- In IntelliJ, click Create New Project from the ‘Welcome’ window or
File>New>Project… from the main IDE window.
- Note: Do not use the New>Project from existing sources… option for Flutter projects.
- Select Flutter in the menu, and click Next.
- Under Project location enter, or browse to, the directory holding your existing Flutter source code files.
- Click Finish.
Editing code, and viewing code problems
The Dart plugin performs code analysis that enables:
- Syntax highlighting.
- Code completions based on rich type analysis.
- Navigating to type declarations (Navigate>Declaration), and finding type usages (Edit>Find>Find Usages).
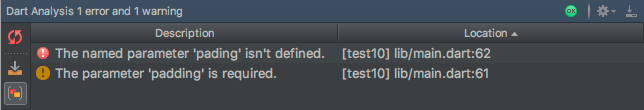
- Viewing all current source code problems (View>Tool Windows>Dart Analysis).
Any analysis issues will be shows in the Dart Analysis pane:
Running and Debugging
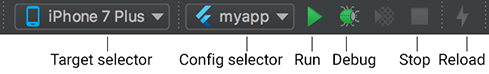
Running and Debugging is controlled from the main toolbar:
Selecting a target
When a Flutter project is open in IntelliJ, you should see a set of Flutter specific buttons on the right-hand side of the toolbar.
Note: If the Run & Debug buttons are disabled, and no targets are listed, Flutter has not been able to discover any connected iOS or Android devices or simulators. You need to connect a device, or start a simulator, to proceed.
- Locate the Flutter Target Selector drop-down button. This will show a
list of available targets. Select the target you want your app to started on.
- When you connect devices, or start simulators, additional entries will appear.
Run app without breakpoints
- Click the Play icon in the toolbar, or invoke Run>Run.
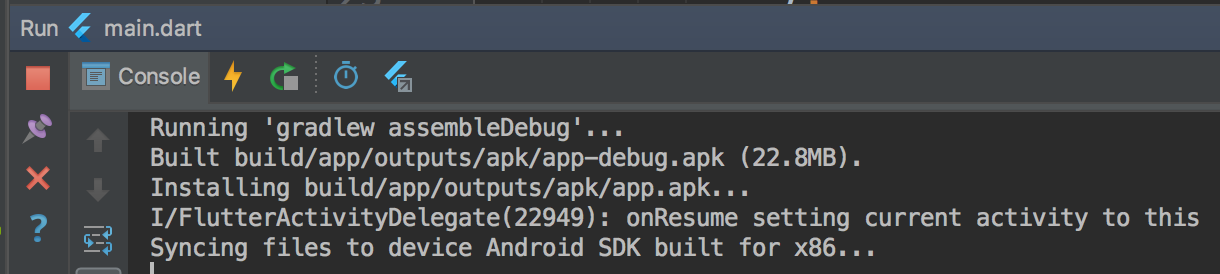
- The bottom Run pane will show logs output:
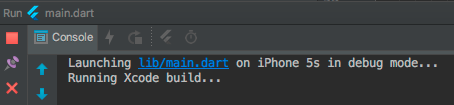
- The bottom Run pane will show logs output:
Run app with breakpoints
- If desired, set breakpoints in your source code.
- Click the Debug icon in the toolbar, or invoke Run>Debug.
- The bottom Debugger pane will show Stack Frames and Variables.
- The bottom Console pane will show detailed logs output.
- Debugging is based on a default launch configuration. To customize this, click. the drop-down button to the right of the device selector, and select Edit configuration.
Fast edit and refresh development cycle
Flutter offers a best-in-class developer cycle enabling you to see the effect of your changes almost instantly with the ‘hot reload’ feature. See Hot reloading Flutter Apps for details.
Advanced debugging
Debugging visual layout issues
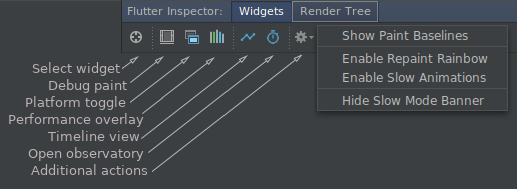
To debug a visual issue, start the app with ‘Debug’, and then open the Flutter inspector tool window using ‘View > Tool Windows > Flutter Inspector’.
This offers many debugging tools; for details on these please see Debugging Flutter Apps.
-
‘Toggle Select Widget Mode’: Select a widget on the device to inspect it in the Flutter Inspector.
-
‘Toggle Debug Paint’: Add visual debugging hints to the rendering displaying borders, padding, alignment, and spacers.
-
‘Toggle Platform Mode’: Toggle between rendering for Android or iOS.
-
‘Toggle Performance Overlay’: Show performance graphs for the GPU & CPU threads.
-
‘Open Timeline View’: Analyze activity of the application as it runs.
-
‘Open Observatory’: A profiler for Dart applications.
Also available in the additional actions menu:
-
‘Show Paint Baselines’: Causes each RenderBox to paint a line at each of its baselines.
-
‘Enable Repaint Rainbow’: Show rotating colors on layers when repainting.
-
‘Enable Slow Animations’: Slow down animations to enable visual inspection.
-
‘Hide Slow Mode Banner’: Hide the ‘slow mode’ banner even when running a debug build.
Debugging with Observatory
Observatory is an additional debugging and profiling tool presented with an html-based UI. For details see the Observatory page.
To open Observatory:
- Run your app in debug mode.
- Select the ‘open observatory’ action from the Debug panel (see screenshot below), click the Stopwatch icon (‘Open Observatory’).
Editing tips for Flutter code
Assists & Quick Fixes
Assists are code changes related to a certain code identifier. A number of these
are available when the cursor is placed on a Flutter widget identifier, as
indicated by the yellow lightbulb icon. The assist can be invoked by clicking
the lightbulb, or by using the keyboard shortcut Alt-Enter, as illustrated
here:
Quick Fixes are similar, only they are shown with a piece of code has an error and they can assist in correcting it. They are indicated with a red lightbulb.
Wrap with new widget assist
This can be used when you have a widget that you want to wrap in a surrounding widget,
for example if you want to wrap a widget in a Row or Column.
Wrap widget list with new widget assist
Similar to the assist above, but for wrapping an existing list of widgets rather than an individual widget.
Convert child to children assist
Changes a child argument to a children argument, and wraps the argument value in a list.
Live Templates
Live templates can be used to speed up entering typical code structures. They are invoked by typing their ‘prefix’, and then selecting it in the code completion window:
The Flutter plugin includes the following templates:
- Prefix
stless: Create a new subclass ofStatelessWidget. - Prefix
stful: Create a new subclass ofStatefulWidgetand it’s associated State subclass. - Prefix
stanim: Create a new subclass ofStatefulWidget, and it’s associated State subclass including a field initialized with anAnimationController.
You can also define custom templates in Settings > Editor > Live Templates.
IntelliJ keyboard shortcuts
Hot Reload
On Linux (IntelliJ keymaps Default for XWin) and Windows the keyboard shortcuts
are ctrl-alt-; and ctrl-\.
On macOS (IntelliJ keymap Mac OS X 10.5+ copy) the keyboard shortcuts are ⌘-⌥-;
and ⌘-\.
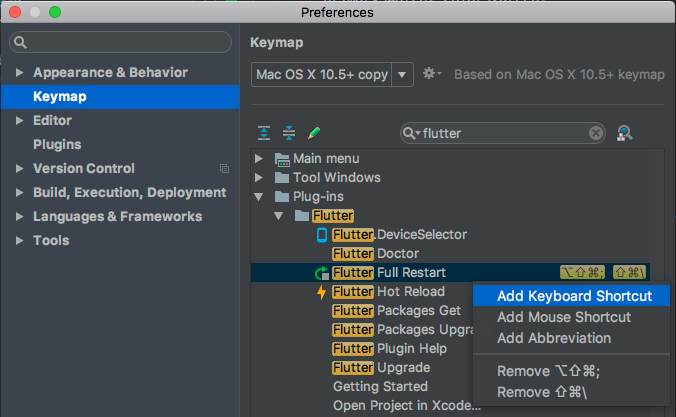
Keyboard mappings can be changed in IntelliJ Preferences/Settings: Select Keymap, then enter flutter into the search box in the upper right corner. Right click the binding you want to change and Add Keyboard Shortcut.
‘Hot Reloads’ vs ‘Full Application Restarts’
Hot Reload works by injecting updated source code files into the running Dart VM (Virtual Machine). This includes not only adding new classes, but also adding methods and fields to existing classes, and changing existing functions. A few types of code changes cannot be hot reloaded though:
- Global variable initializers.
- Static field initializers.
- The
main()method of the app.
For these changes you can fully restart your application, without having to end your debugging session:
- Don’t click the Stop button; simply re-click the Run button (if in a run session) or Debug button (if in a debug session), or shift-click the ‘hot reload’ button.
Editing Android code in IntelliJ IDEA
To enable editing of Android code in IntelliJ IDEA, you need to configure the location of the Android SDK:
- In Preferences->Plugins, enable Android Support if you haven’t already.
- Right-click the android folder in the Project view, and select Open Module Settings.
- In Sources tab, locate the Language level field, and select level ‘8’ or later.
- In Dependencies tab, locate the Module SDK field, and select an
Android SDK. If no SDK is listed, click New… and specify the location of
the Android SDK. Make sure to select an Android SDK matching the one used by
Flutter (as reported by
flutter doctor). - Click OK.
Tips and tricks
Please checkout these ‘cheat sheets’:
Troubleshooting
Known issues and feedback
Important known issues that may impact your experience are documented in the Flutter plugin README file.
All known bugs are tracked in the issue trackers:
- Flutter plugin: GitHub issue tracker.
- Dart plugin: JetBrains YouTrack.
We very much welcome feedback, both on bugs/issues and feature requests. Prior to filing new issues, please:
- do a quick search in the issue trackers to see if the issue is already tracked.
- make sure you have updated to the most recent version of the plugin.
When filing new issues, please include the output of flutter
doctor.